How to monitor heat stress using your DHI Herd Summary Report
Written by Theodore Halbach, Maria Fuenzalida Valenzuela and Lyssa Seefeldt
A part of University of Wisconsin-Madison Heat Stress program.
For the best viewing experience, please view this article on a desktop computer.
Herd Summary Report
Farmers enrolled in DHI receive several reports regarding herd performance. The Herd Summary Report (HSR) encompasses three main sections: Milk Production, Reproduction & Genetics, and Inventory. The milk production section has eight blocks—the focus will be on Block D, F, and G. The Reproduction & Genetics section has five blocks—the focus will be on Block L.
Terminology and Definitions
RHA is an average amount of milk produced by the average cow in the herd for the last 365 days.
ME 305 is an expected total milk production for each cow through a 305-day lactation, and subsequently adjusting the total projected milk to standardize for parity, age, season of calving, and number of times milked per day. ME 305 better reflects seasonal changes compared to RHA.
MLM standardizes every cow 305 days or less since her last calving, to a second lactation cow, 150 days in milk with a 4.0% fat and 3.3% protein. MLM should be used for short-term comparisons.
Pregnancy rate is the percentage of cows becoming pregnant out of all eligible cows to be bred, within a time frame.
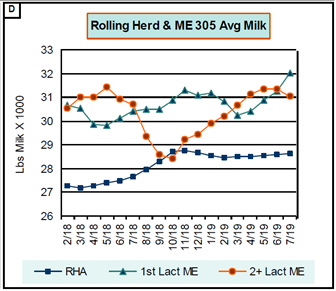
Block D
ME 305 of multiparous cows dropped from June until October. This is a good example of the impact of heat stress. Expected total milk production losses increased as summer went along and the cold season started. Remember that heat stress has an immediate and delayed impact on milk production. This can explain expected milk production losses going into the cold season.
ME 305 of primiparous cows remained consistent. RHA did not reflect any decrease in milk production.
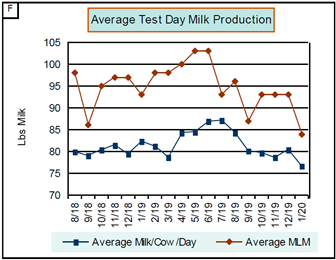
Block F
Average MLM decreased starting on June until September. Compared to average MLM of June, milk production from July to September decreased about 8 pounds (range of 5 to 12.5 pounds) per cow per day. In the figure below, MLM was trending up until May and then dropped. It might be possible that heat stress has caused this drop in production. When looking at this block, farmers should expect upward trends in MLM.
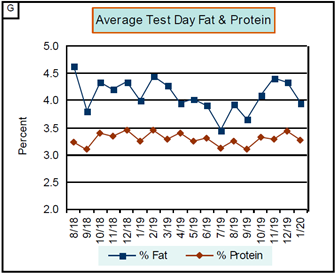
Block G
Loss of milk components, such as fat, is very typical when cows are experiencing heat stress. In the figure below, milk fat depression started in May, and lasted until September. Losses were about 0.35 (range from 0.10-0.57) percentage points per month starting on June-September when compared to percent fat in May. Remember that milk fat varies depending on when (AM or PM) plants conduct monthly testing. Fat is higher in the morning and you need to keep that in mind when reading your DHI report.
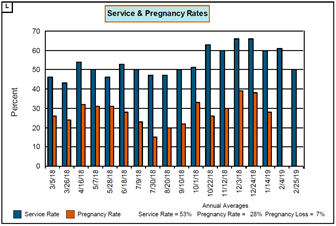
Block L
In the Block L figure you can see a decrease in pregnancy rates during warmer months compared to colder months. The lowest pregnancy rate was observed on July 30, which was 10 percentage points lower than in March. Again, this is a textbook example of the potential impact of heat stress on reproduction performance.
Conclusion
Heat stress negatively affects milk production and reproduction performance. DHI reports provide summarized information like a picture of your herd’s performance. When you look at your HSR, look for seasonal changes, especially during warm months. Until you conduct an investigation, you cannot rule out heat stress or any other factor as responsible for losses in milk production and reproduction performance in your herd.
Economic Impact
The economic impact of heat stress is large. Following the information extracted from the Herd Summary, it is possible to estimate the potential losses.
Assuming a marginal milk production of 2.4 pounds per pound of feed, the loss would be $0.11 per pound of milk not produced (at $0.16 per pound of milk and $0.12 per pound of feed). A daily loss of 8 pounds per cow per day (Block F) equals to losses of $0.88 per cow per day during summer months.
Considering a price of $2.68 per pound of fat, 0.35% milk fat depression (Block G) represents a reduced price received for milk sales of $0.938 per hundredweight due to heat stress during warmer months.
A decrease of pregnancy rate from 35% to 25% (Block L) would represent a loss of $7.90 per cow in the month of July compared to the month of May (https://dairymgt.info/markov/reader.php).
Take Home Messages
- Use DHI reports to look for seasonal changes.
- Use ME 305 because it reflects seasonal changes.
- If you see depression in milk production and/or milk fat during warmer months, then start an investigation to determine the cause.
- Milk fat varies depending on when the plant is testing—morning versus afternoon.
- Create a team to help you investigate seasonal depression in milk production. You can use your herd veterinarian, dairy and nutritional consultants, and herd manager.
- It is important to determine the economic impact of heat stress in your herd to motivate actions and investments to alleviate them.